RE:JYK · 2026
Before 2030,
whoever builds the collection network first,
wins.
We're building the recycling supply chain in Cambodia.
22.7x
Monthly throughput growth · month 1 vs. trailing 6-mo avg
1,835 t
26-month cumulative throughput · tracked monthly
01 · Clock
One in every three bottles
must be made from recycled bottles.
The EU's PPWR applies package by package, not as a national average — and today's market is still near zero.
Per-package compliance
Every bottle must comply
A legal obligation
No audit trail, no legal market access
Only gets stricter
The threshold rises every year, never eases
02 · Schedule
Can today's market
produce enough supply?
The recycled-content ratio is already written into law, rising every year — this is a schedule, not a forecast
03 · Mismatch
Capacity has never been the scarce resource.
Collection rate, mature markets
>90%
The network already exists; scarcity is feedstock competition
VS
Collection rate, developing markets
<30%
Factory lines take months to build. Collection networks take years
Build the collection network now—not more capacity
04 · Supply Network
We're not a recycling plant.
We're Cambodia's only PET supply network.
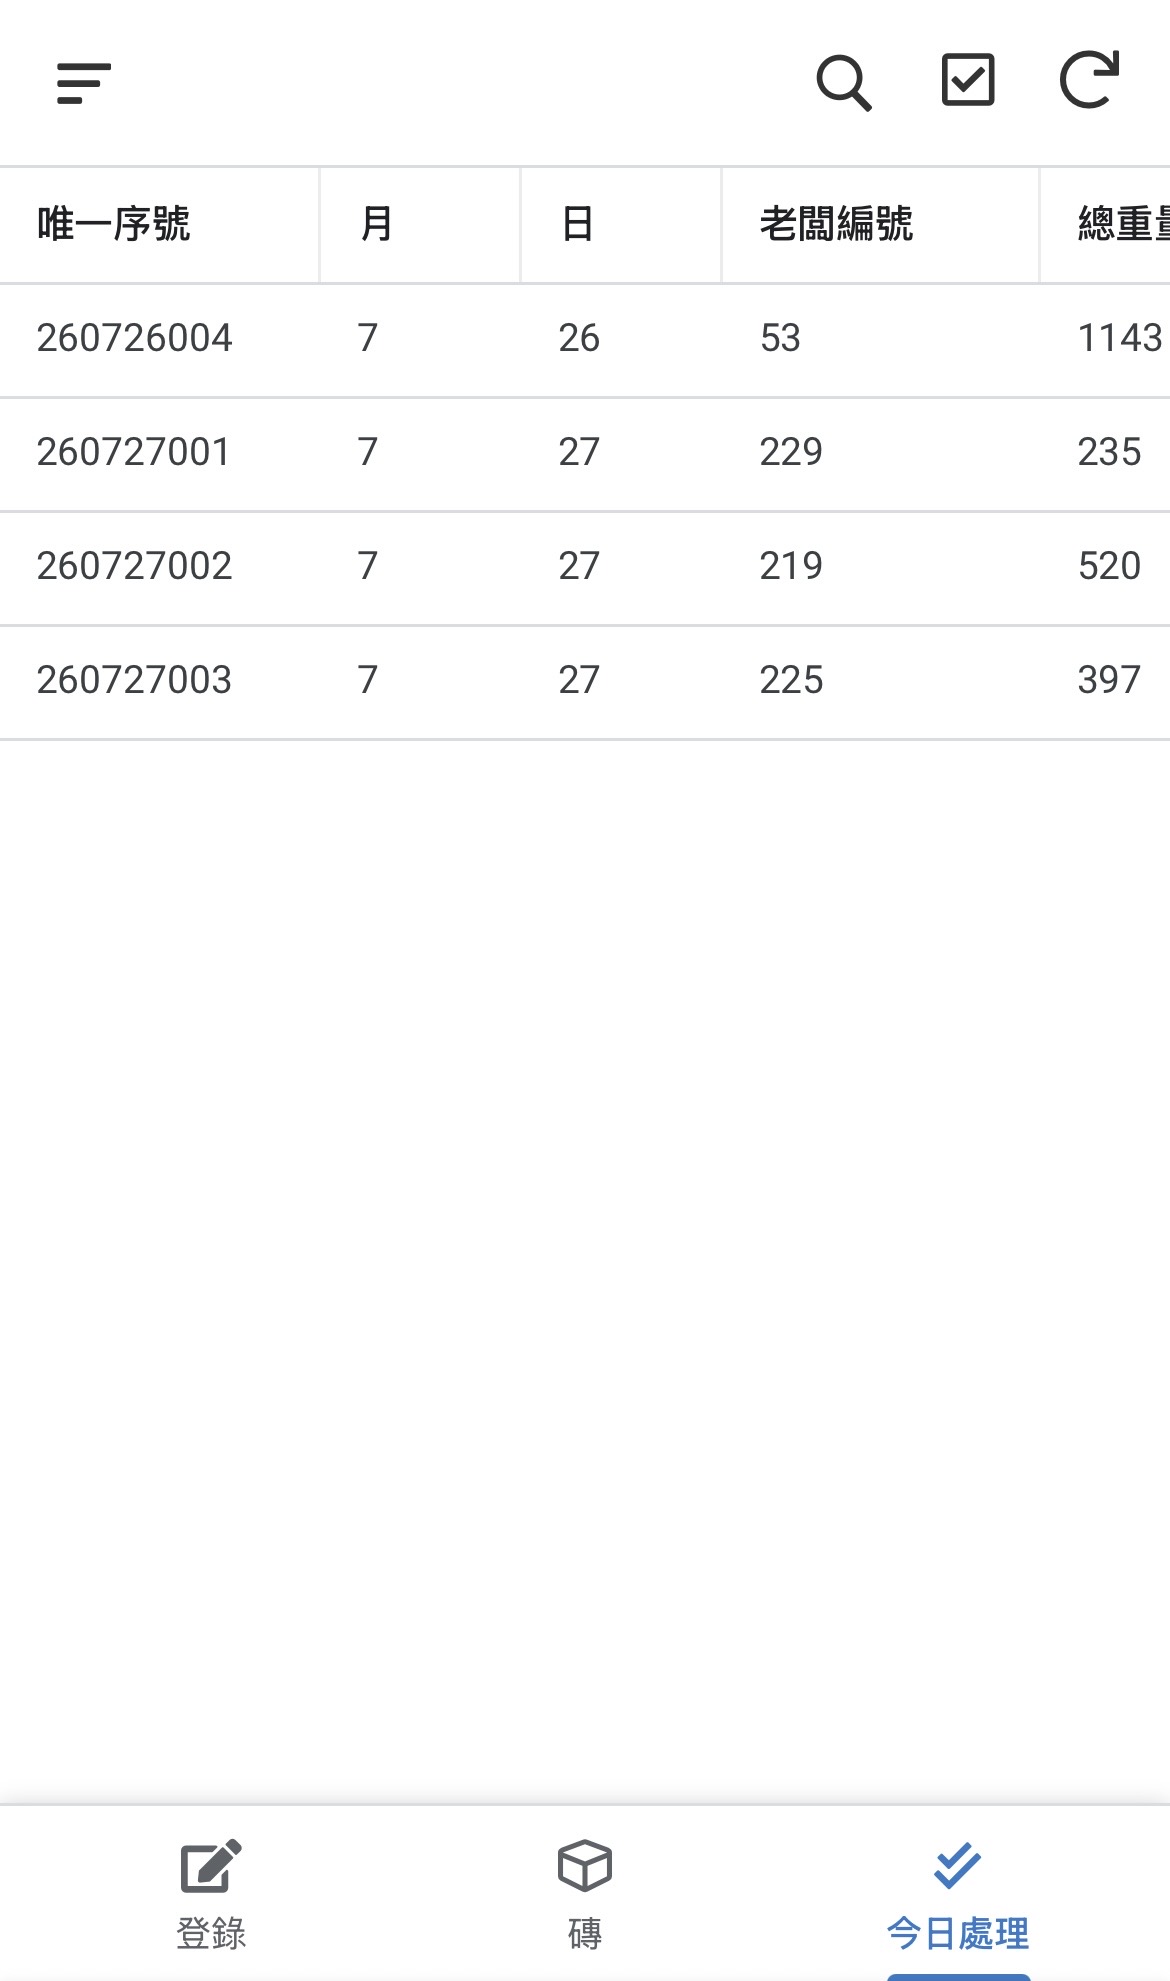
Every batch is logged in the system, from purchase to settlement.
01
Collect
200+ nodes buy post-consumer PET
02
Sort
Split by resin type and contamination rate
03
De-label
Labels and contaminants removed
04
Bale
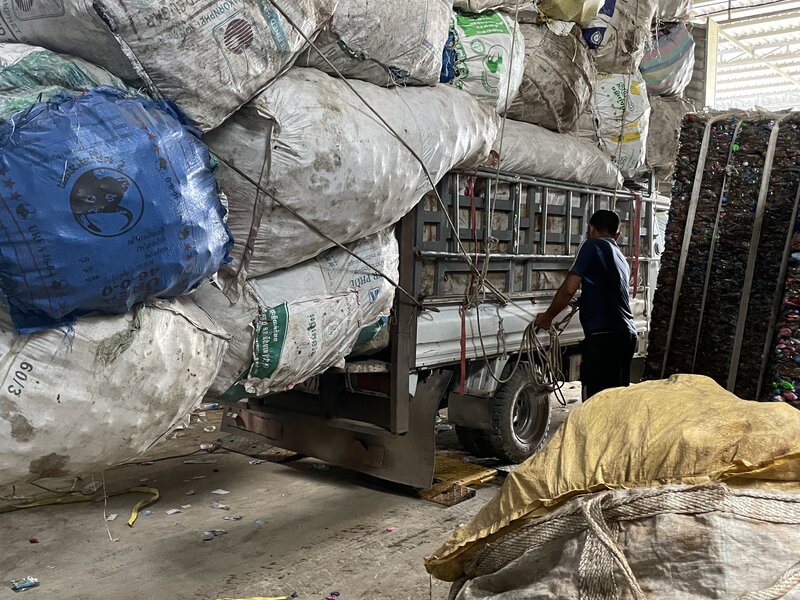
Compressed into bales, weighed per batch
05
Ship
Batch-level processing records
Others sell bottles.
We sell traceable bottles.
Unique ID / supplier no. / total weight, logged live
05 · Location
200+
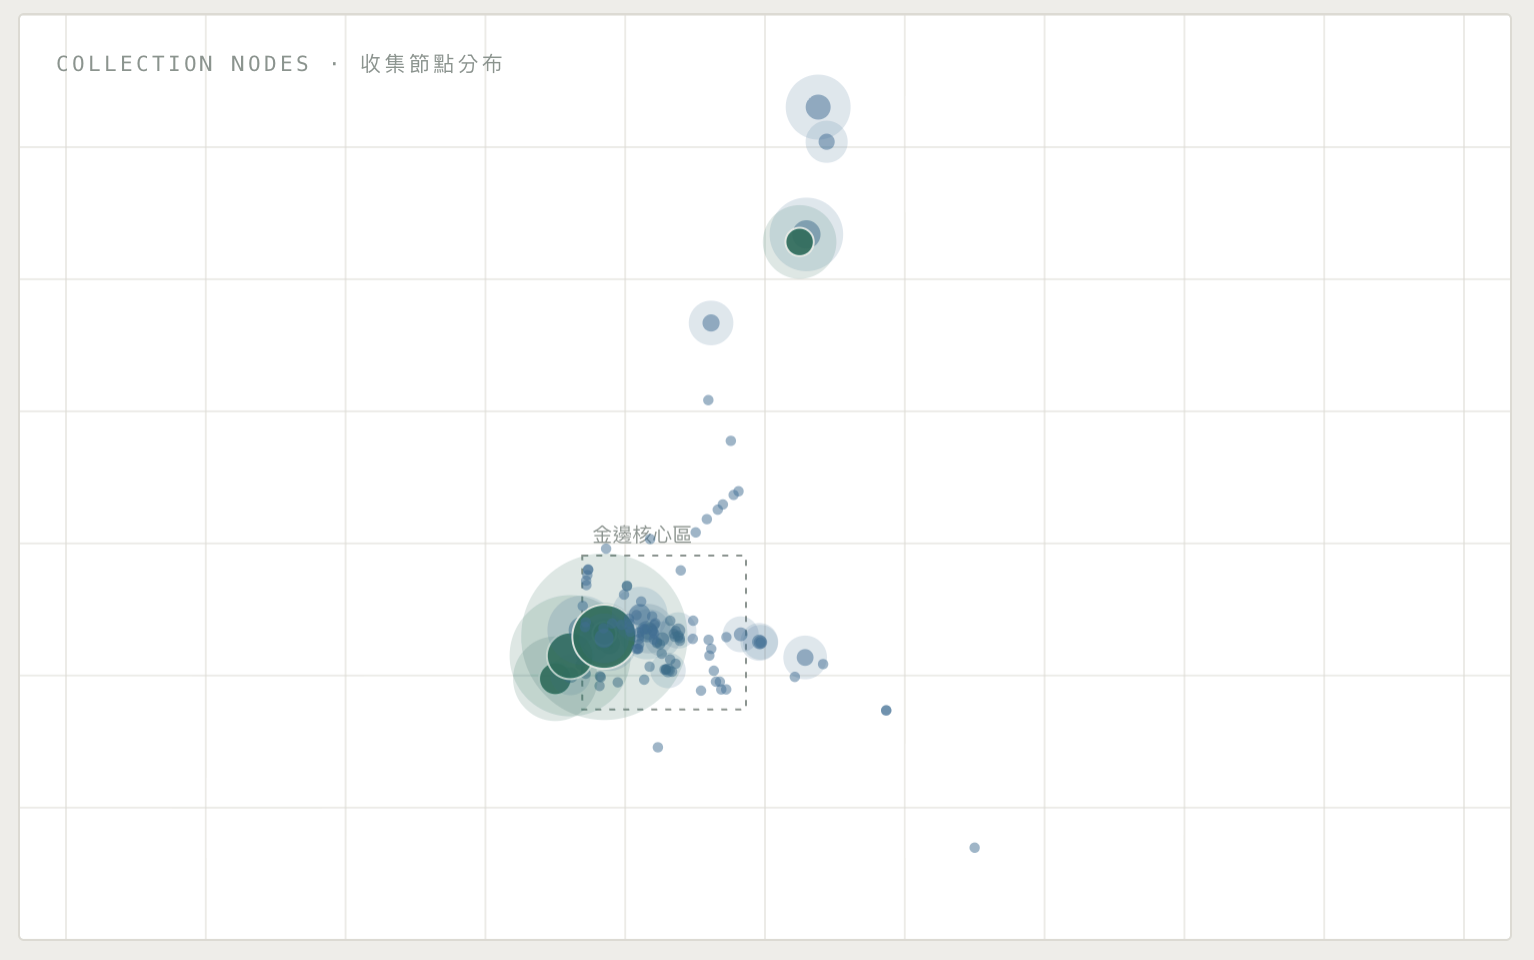
Collection points
More than 50,000 records
Centered on Phnom Penh, now expanding to the provinces
Started collecting May 2024, first shipment in June — monthly throughput tracked ever since
Khmer-language interface, used directly by on-site staff
06 · System
We're the buyer who knows
the true cost of every batch.
Waste 5.2%
Labels 5.1%
Oil containers 3.1%
Moisture 1.9%
Inbound composition measured to 0.1%—
this isn't reporting power, it's pricing power
Capture scale photo + code→
Check price + create batch ID→
Record deductions by category→
Issue settlement in five formats→
Close the feedback loop
No manual transcription
Suppliers are graded by contamination rate to guide pricing and retention
07 · Moat
What money can't buy:
time under validation.
What competitors can buy
Suppliers
and systems
A higher bidder can lure away suppliers — that's the truth.
Systems can be built with money too.
What competitors can't buy
Time under
validation
Buying suppliers doesn't instantly transfer two years of operating alignment, reporting discipline, and field-level iteration.
Before 2030, downstream customers will sign with partners who have already proven stable supply — not those just starting to build a track record.
08 · Why Now
A collection network
takes two years to build —
2030 is only 4 years away.
To deliver auditable feedstock before the mandate takes effect, the network has to be operating now. In Cambodia, we've already completed those two years.
09 · Growth
Monthly throughput grew 22.7x in 26 months
From 6.3 t in month one to a peak of 182.3 t (Mar 2026), with a trailing 6-month average of 143 t. Actual monthly inbound throughput, including shutdown months — no estimates.
2025/5–7
Process/layout tuning
2024 05–12
2025
2026 01–06
1,835 t
26-month cumulative inbound throughput
143 t
Average monthly throughput over the last six months (H1 2026)
81% → 85.7%
Yield improved as volume declined — the pullback was deliberate optimization
10 · Financial Growth
Bigger scale, bigger margins.
Since our first revenue half-year, revenue and gross margin have grown together for four consecutive periods.
Build-out phase
no sales yet
3.6x
Half-year revenue scale
2024 H2 → 2026 H1
4 / 4
Revenue and gross margin
rose together for 4 straight periods
-2.9% → 13.1%
Gross margin turned positive
and kept expanding
11 · Unit Economics
Gross profit per ton holds up at scale.
Purchase price
$272.5
per ton
Selling price
$362
per ton
Gross profit
$89.5
per ton
Unit maintenance cost
$4.60–6.00/ton · 563 records
$89.5 is the clean-batch purchase/sale spread, verifiable line by line. Blended quarterly gross margin is calculated separately — 13.1% in 2026 H1
These are two different measures, not the same number
This network, equipment, 26 months of records, and 1,835 t of cumulative throughput were built at a fraction of a comparable plant's capital cost
12 · Team
The three people
who made it happen
26 months, 1,835 t, and remarkably little capital
A team shaped by Taiwan's 40-year recycling transformation and grounded in local execution
Jim Cheng
CEO
Former e-commerce executive and CEO of a Cambodian microfinance company. Capital strategy and international development; Agricultural Economics, NTU.
Andrew Lin
COO
8+ years scaling startups from zero to one. Leads financial execution and field coordination; Business Administration, NTU.
Kim Hok
CCO
Leads ground operations and supplier relationships, with deep roots in Cambodia's recycling ecosystem.
13 · The Round
Post-money valuation
~$1.6M
Investor return pathways · three routes
01
Next round or acquisition
Primary exit path after scaling
02
Profit distributions
Optional participation in net-profit distributions once margins stabilize
03
Company buyback
A buyback mechanism if neither of the first two occurs within the agreed term
Comparable industry transactions — CarbonLITE (sold for $292M even after its 2021 bankruptcy auction), PETVALUE ($39M joint venture). Even distressed assets command this price — that reflects the industry floor, not a peak valuation.
14 · What's Next
Three priorities
The 12-month objectives are shown below; interim metrics are tracked internally.
Expand gross margin
25%+
12-month gross margin
3 months Sustain 15%+ gross margin
6 months Reach 88% yield and 20%+ gross margin
Break the volume bottleneck
300t
Approach monthly capacity within 12 months
3 months Sustain 150 t/month
6 months Exceed 200 t/month
Launch a new revenue stream
1st
First non-PET revenue within 12–18 months
3–6 months Complete one new-market feasibility study
9 months Launch the first pilot
15 · Endgame
This system can be replicated
in every market with a supply gap.
We built an operating system that turns informal recycling into auditable supply. Cambodia is the first proof point — not the only market.
Moving downstream is an option, not the plan
Stay asset-light; add capacity only after the gap becomes cash flow
PROVEN → REPLICABLE
Cambodia
Proven: collection network · batch traceability · audit documentation
LIVE
South Asia
Informal collection already exceeds 90% (India, representative) — the gap is structured, auditable supply, not collection rate
Rest of SE Asia
National collection rate 26% · uncollected leakage 660K t/yr
Latin America
Plastics recycling 20.6% (Brazil) · PET recycled 410K t/yr
South Asia figures represent India; Latin America figures represent Brazil — not full-region data. Source: GA Circular's Full Circle report (6 SE Asian countries) and public reporting; not yet verified against local primary sources.
1984
Disposal, landfilling
1997
Incineration, Four-in-One Recycling
2010s
Zero waste, producer responsibility
2022
Resource Circulation Admin. established
Taiwan took 38 years to build this. We compressed it into a deployable operating model.
RE:JYK
The best time was
ten years ago.
The second best time is
today.
Every bottle deserves a second life.
Jim Cheng / hirejyk@gmail.com
https://rejyk.com